Canada’s Food & Beverage Manufacturing Industry
Although food and beverage processing businesses are significant sources of employment in every province and territory, they are mostly concentrated in Ontario, Quebec and British Columbia.
11 sub-sectors make up Canada’s food and beverage manufacturing industry

The industry is divided into 11 sub-sectors, each processing a wide variety of products. Meat Product Manufacturing was the sub-sector with the largest workforce in 2020, employing 65,113 people, followed by Bakeries and Tortilla Manufacturing(46,691), Beverage Manufacturing (42,094) and Other Food Manufacturing (35,543). Cannabis Product Manufacturing had the smallest workforce (2,700),while Grain and Oilseed Milling employed 8,722 people.

Animal Food Manufacturing
The animal food manufacturing sector is comprised of establishments primarily engaged in manufacturing food and feed for animals, including pets.
Sector Profile
In June 2022, there were 652 establishments in the animal food manufacturing sector representing 4.8% of the total food and beverage manufacturing industry. Similar to the broader industry, more than 96.8% of the 652 establishments employ fewer than 100 employees. 47.5% of these establishments are classified as micro-organizations, having 4 or fewer workers.
Across the 11 subsectors of the Canadian food and beverage processing industry, animal food manufacturing is the 5th largest in terms of number of establishments. Ontario and Quebec are home to almost 54.4% of all animal food manufacturing facilities within Canada. British Columbia and Alberta also have a concentration of animal food manufacturing facilities.
The trading balance for this sector has decreased from -$68.6M 2017 to -$195M in 2021.
The total number of workers in the sector was 10,479 in 2021 and has decreased 6% since 2017 (9,923). The workforce within this sector has seen a decrease in comparison with the industry as a whole, which saw a 12% increase during the same time frame.
Revenue Trends
Total revenues for the animal food manufacturing have increased from $8.9B in 2017 to $10B in 2020.
Average annual Canadian household expenditures related to pets e.g., pet food, veterinarian, pet-related goods, amounted to $755 in 2019, compared to $590 in 2015

Grain and Oilseed Milling
The grain and oilseed milling sector is comprised of establishments primarily engaged in milling grains and oilseeds, refining and blending fats and oils, and making breakfast cereal products. The sector has the following sub-categories:
- Flour milling and malt manufacturing – 31121
- Starch and vegetable fat and oil manufacturing – 31122
- Breakfast cereal manufacturing – 31123
Sector Profile
In June 2022, there were 293 establishments in grain and oilseed milling representing 2.2% of the total food and beverage processing industry. Similar to the broader industry, more than 94.2% of the 276 establishments employ fewer than 100 employees. 51.2% of these establishments are classified as micro-organizations, having 4 or fewer workers.
Across the 11 subsectors of the Canadian food and beverage processing industry, grain and oilseed milling is the 10th largest in terms of number of establishments. Ontario and Quebec are home to almost 50.5% of all grain and oilseed milling facilities within Canada. Manitoba, Saskatchewan, British Columbia and Alberta also have a concentration of grain and oilseed milling facilities.
The trading balance for this sector has increased from $3.6B in 2017 to $5.9B in 2021.
The total number of workers in the sector was 9014 in 2021 and has decreased 31% since 2017 (6,871). The workforce within this sector has seen a decrease in comparison with the industry as a whole, which saw a 12% increase during the same time frame.
Revenue Trends
Total revenues for grain and oilseed milling have increased from $11.8B in 2017 to $16B in 2020.

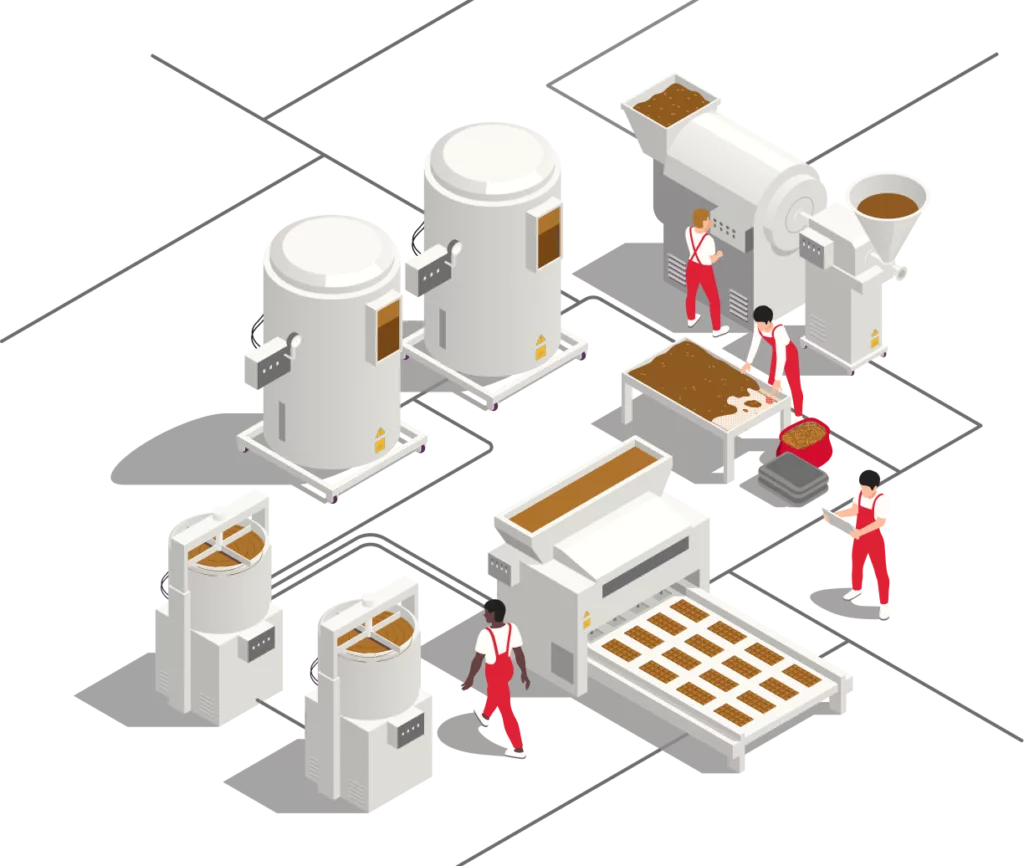
Sugar and Confectionery Product Manufacturing
The sugar and confectionery product manufacturing sector is comprised of establishments primarily engaged in manufacturing sugar and confectionery products. The sector has the following sub-categories:
- Sugar manufacturing – 31131
- Non-chocolate confectionery manufacturing – 31134
- Chocolate and chocolate confectionery manufacturing – 31135
Sector Profile
In June 2022, there were 540 establishments in sugar and confectionery product manufacturing representing 4.0% of the total food and beverage processing industry. Similar to the broader industry, more than 94.6% of the 540 establishments employ fewer than 100 employees. 58.1% of these establishments are classified as micro-organizations, having 4 or fewer workers.
Across the 11 subsectors of the Canadian food and beverage processing industry, sugar and confectionery product manufacturing is the 9th largest in terms of number of establishments. Ontario and Quebec are home to almost 74.4% of all sugar and confectionery product manufacturing facilities within Canada. British Columbia also has a concentration of sugar and confectionery product manufacturing facilities.
The trading balance for this sector has increased from -$73.3M in 2017 to $216.3M in 2021.
The total number of workers in the sector was 9,716 in 2021 and has decreased 4% since 2017 (10,173). The workforce within this sector has seen a decrease in comparison with the industry as a whole, which saw a 12% increase in the same time frame.
Revenue Trends
Total revenues for the sugar and confectionery product manufacturing have decreased from $4.3B in 2017 to $4.2B in 2020

Fruit and Vegetable Preserving and Specialty Food Manufacturing
The fruit and vegetable preserving and specialty food manufacturing sector is comprised of establishments primarily engaged in manufacturing frozen fruits and vegetables, frozen entrees and side dishes of several ingredients (except seafood), and fruits and vegetables preserved by pickling, canning, dehydrating and similar processes. The sector has the following sub-categories:
- Frozen food manufacturing – 31141
- Fruit and vegetable canning, pickling and drying – 31142
Sector Profile
In June 2022, there were 588 establishments in the fruit and vegetable preserving and specialty food manufacturing representing 4.3% of the total food and beverage processing industry. Similar to the broader industry, more than 89.6% of the 588 establishments employ fewer than 100 employees. 54.8% of these establishments are classified as micro-organizations, having 4 or fewer workers.
Across the 11 subsectors of the Canadian food and beverage processing industry, fruit and vegetable preserving and specialty food manufacturing is the 6th largest in terms of number of establishments. Ontario and Quebec are home to almost 63.3% of all fruit and vegetable preserving and specialty food manufacturing facilities within Canada. British Columbia and Alberta also have a concentration of fruit and vegetables preserving and specialty food manufacturing facilities.
The trading balance for this sector has increased from -$1.2B in 2017 to -$423.3M in 2021.
The total number of workers in the sector was 19,627 in 2021 and has increased 12% since 2017 (17,500). The workforce within this sector has seen an increase in comparison with the industry as a whole, which saw a 12% increase in the same time frame.
Revenue Trends
Total revenues for the fruit and vegetables preserving and specialty food manufacturing has increased from $7.8B in 2017 to $8.5B in 2020.

Dairy Product Manufacturing
The dairy product manufacturing sector is comprised of establishments primarily engaged in manufacturing dairy products. Establishments primarily engaged in manufacturing substitute products are also included. The sector has the following sub-categories:
- Dairy product (except frozen) manufacturing – 31151
- Ice cream and frozen dessert manufacturing – 31152
Sector Profile
In June 2022, there were 547 establishments in dairy product manufacturing representing 4.0% of the total food and beverage processing industry. Similar to the broader industry, more than 86.1% of the 547 establishments employ fewer than 100 employees. 39.5% of these establishments are classified as micro-organizations, having 4 or fewer workers.
Across the 11 subsectors of the Canadian food and beverage processing industry, dairy product manufacturing is the 8th largest in terms of number of establishments. Ontario and Quebec are home to almost 68.7% of all dairy product manufacturing facilities within Canada. British Columbia and Alberta also have a concentration of dairy product manufacturing facilities.
The trading balance for this sector has decreased from -$274.5M in 2017 to -$329.7M in 2021.
The total number of workers in the sector was 26,817 in 2021 and has increased 15% since 2017 (23,417). The workforce within this sector has seen an increase in comparison with the industry as a whole, which saw a 12% increase in the same time frame.
Revenue Trends
Total revenues for the dairy product manufacturing have increased from $15.8B in 2017 to $17.4B in 2020.

Meat Manufacturing
The meat product manufacturing sector is comprised of establishments primarily engaged in manufacturing meat products.
Sector Profile
In June 2022, there were 1,003 establishments in the meat product manufacturing sector representing 7.4% of the total food and beverage processing industry. Similar to the broader industry, more than 86.6%% of the 1003 establishments employ fewer than 100 employees. 42.3% of these establishments are classified as micro-organizations, having 4 or fewer workers.
Across the 11 subsectors of the Canadian food and beverage processing industry, meat product manufacturing is the 4th largest in terms of number of establishments. Ontario and Quebec are home to almost 55.5% of all meat product manufacturing facilities within Canada. British Columbia, Alberta, Manitoba and Saskatchewan also have a concentration of meat product manufacturing facilities.
The trading balance for this sector has increased from $3.7B in 2017 to $6.5B in 2021.
The total number of workers in the sector was 63,067 in 2021 and has increased by 8% since 2017 (58,649). The workforce within this sector has seen an increase in comparison with the industry as a whole, which saw a 12% increase in the same time frame.
Revenue Trends
Total revenues for the meat product manufacturing have increased from $29.9B in 2017 to $32.7B in 2020.

Seafood Product Preparation and Packaging
The seafood product preparation and packaging sector is comprised of establishments primarily engaged in canning seafood (including soup), smoking, salting and drying seafood, and preparing fresh fish by removing heads, fins, scales, bones and entrails. These establishments are also engaged in shucking and packing fresh shellfish, processing marine fats and oils, and freezing seafood. Establishments known as “floating factory ships” that are engaged in shipboard processing of seafood, are also included.
Sector Profile
In June 2022, there were 554 establishments in seafood product preparation and packaging representing 4.1% of the total food and beverage processing industry. Similar to the broader industry, more than 82.9% of the 554 establishments employ fewer than 100 employees. 43.9% of these establishments are classified as micro-organizations, having 4 or fewer workers.
Across the 11 subsectors of the Canadian food and beverage processing industry seafood product preparation and packaging is the 7th largest in terms of number of establishments. British Columbia and Atlantic are home to almost 75.1% of all seafood product preparation and packaging facilities within Canada. Ontario and Quebec also have a concentration of seafood product preparation and packaging facilities.
The trading balance for this sector has increased from $1.5B in 2017 to $2.6B in 2021.
The total number of workers in the sector was 21,002 in 2021 and has decreased by 4% since 2017 (21,826). The workforce within this sector has seen a decrease in comparison with the industry as a whole, which saw a 12% increase in the same time frame.
Revenue Trends
Total revenues for the seafood product preparation and packaging have decreased from $6.5B in 2017 to $5.9B in 2020.

Bakeries and Tortilla Manufacturing
The bakeries and tortilla manufacturing sector is comprised of establishments primarily engaged in manufacturing baked goods. Establishments primarily engaged in manufacturing bakery products, for retail sale, but not for immediate consumption, are included. This sector has the following sub-categories:
- Bread and bakery product manufacturing – 31181
- Cookie, cracker and pasta manufacturing – 31182
- Tortilla manufacturing – 31183
Sector Profile
In June 2022, there were 3,204 establishments in bakeries and tortilla manufacturing representing 23.7% of the total food and beverage processing industry. Similar to the broader industry, more than 96.9% of the 3,204 establishments employ fewer than 100 employees. 50.2% of these establishments are classified as micro-organizations, having 4 or fewer workers.
Across the 11 subsectors of the Canadian food and beverage processing industry, bakeries and tortilla manufacturing is the 1st largest in terms of number of establishments. Ontario and Quebec are home to almost 62.7% of all bakeries and tortilla manufacturing facilities within Canada. British Columbia and Alberta also have a concentration of bakeries and tortilla manufacturing facilities.
The trading balance for this sector has increased from $1.4B in 2017 to $2.5B in 2021. The total number of workers in the sector was 50,846 in 2021 and has increased by 10% since 2017 (46,347). The workforce within this sector has seen an increase in comparison with the industry as a whole, which saw a 12% increase in the same time frame.
Revenue Trends
Total revenues for the bakeries and tortilla manufacturing increased from $11.1B in 2017 to $12.4B in 2020.

Other Food Manufacturing
The other food manufacturing sector is comprised of establishments not classified to any other industry group, but still are primarily engaged in manufacturing food. The sector has the following sub-categories:
- 31191 – Snack food manufacturing
- 31192 – Coffee and tea manufacturing
- 31193 – Flavouring syrup and concentrate manufacturing
- 31194 – Seasoning and dressing manufacturing
- 31199 – All other food manufacturing
Sector Profile
In June 2022, there were 3,184 establishments in other food manufacturing representing 23.5% of the total food and beverage processing industry. Similar to the broader industry, more than 97.3% of the 3,184 establishments employ fewer than 100 employees. 67.9% of these establishments are classified as micro-organizations, having 4 or fewer workers.
Across the 11 subsectors of the Canadian food and beverage processing industry, other food manufacturing is the 2nd largest in terms of number of establishments. Ontario and Quebec are home to almost 60.1% of all other food manufacturing facilities within Canada. British Columbia and Alberta also have a concentration of other food manufacturing facilities.
The trading balance for this sector has decreased from -$2.2B in 2017 to -$2.4B in 2021.
The total number of workers in the sector was 38,571 in 2021 and has increased 19% since 2017 (32,320). The workforce within this sector has seen an increase in comparison with the industry as a whole, which saw a 12% increase in the same time frame.
Revenue Trends
Total revenues for the other food manufacturing have increased from $11.9B in 2017 to $14.4B in 2020.

Beverage Manufacturing
The beverage manufacturing sector is comprised of establishments primarily engaged in manufacturing beverages. The sector has the following sub-categories:
- Soft drink and ice manufacturing – 31211
- Breweries – 31212
- Wineries – 31213
- Distilleries – 31214
Sector Profile
In June 2022, there were 2,717 establishments in the beverage manufacturing representing 20.1% of the total food and beverage processing industry. Similar to the broader industry, more than 97.2% of the 2,717 establishments employ fewer than 100 employees. 51.6% of these establishments are classified as micro-organizations, having 4 or fewer workers.
Across the 11 subsectors of the Canadian food and beverage processing industry, beverage manufacturing is the 3rd largest in terms of number of establishments. Ontario and British Columbia are home to almost 61.0% of all beverage manufacturing facilities within Canada. Quebec, Alberta and Nova Scotia also have a concentration of beverage manufacturing facilities.
The trading balance for this sector has decreased from -$4.4B in 2017 to -$4.7B 2021.
The total number of workers in the sector was 45,799 in 2021 and has increased 18% since 2017 (38,925). The workforce within this sector has seen an increase in comparison with the industry as a whole, which saw a 12% increase in the same time frame.
Revenue Trends
Total revenues for beverage manufacturing have increased from $13.3B in 2017 to $14.5B in 2020.

Cannabis Product Manufacturing
The Cannabis product manufacturing sector is comprised of establishments primarily engaged in manufacturing products made from Cannabis plants with a level of tetrahydrocannabinol (THC) greater than 0.3%.
Sector Profile
In June 2022, there were 250 establishments in Cannabis product manufacturing representing 1.8% of the total food and beverage processing industry. Similar to the broader industry, more than 95.2% of the 250 establishments employ fewer than 100 employees. 60.0% of these establishments are classified as micro-organizations, having 4 or fewer workers.
Across the 11 subsectors of the Canadian food and beverage processing industry, Cannabis product manufacturing is the 11th largest in terms of number of establishments. Ontario and British Columbia are home to almost 67.6% of all Cannabis product manufacturing facilities within Canada. Quebec and Alberta also have a concentration of Cannabis product manufacturing facilities.
There is no data available on the trade balance for the Cannabis sector.
The total number of workers in the sector was 3,722 in 2021.
Revenue Trends
The Cannabis sector is new, and as a result there is not sufficient data available to provide revenue trends.
Sector Survey Reports
As part of FPSC’s labour market initiative, new reports are available that take a deep dive into the business and employment environments for sub-sector businesses. Here is our first three survey reports in this series.
Resources
Videos & Webinars
On demand videos & webinars on a variety of topics.
Career Ladders
Learn about career ladders in the food and beverage processing industry.
Employer Programs
Employer programs for Canada’s food and beverage processing industry.
Featured reports

Rapid Results Survey 2: Focus on Immigration
In response to demand for more current labour market information, Food Processing Skills Canada developed the Rapid Results
Employer Opinion Panel. As G.I. Joe said, “knowing is half the battle” and getting up to date industry information gets you more
informed to meet the challenges that you face.
Industry Growth and Outlook
The Canadian food and beverage manufacturing industry will need 142,000 new people between 2023 and 2030 or almost 50% of the current workforce.